How Many Candlestick Patterns Are There?
Introduction
If you’ve ever looked at a stock chart filled with red and green bars, you’ve seen candlesticks in action. These little “sticks” tell powerful stories—stories of price battles between buyers and sellers. But ever wondered how many candlestick patterns are there and what they mean? You’re not alone!
Many beginners (and even pros) find these patterns fascinating because they help predict market trends. In this article, we’ll explore trading candlestick patterns in simple terms. Think of it as learning to read market “moods”—like a stock market teacher guiding you from curiosity to confidence.
Discover how many candlestick patterns are there, learn about trading candlestick patterns, and get insights from a stock market teacher.
What Are Candlestick Patterns?
Candlestick patterns are visual representations of price movements on a chart. Each “candlestick” shows how a stock’s price moved during a specific time—say one day, one hour, or one minute.
Each candle has four vital parts:
- Open – the price at which trading started.
- Close – the price when trading ended.
- High – the highest price reached.
- Low – the lowest price traded.
These parts combine to form a candle’s body and wick, often colored green for bullish (upward) or red for bearish (downward) moves.
The History Behind Japanese Candlesticks
Candlestick charts were developed in Japan over 300 years ago by Munehisa Homma, a rice trader. He noticed that price movements were influenced by emotions—fear and greed—just like modern trading today!
This technique made its way to the Western world through Steve Nison, who popularized it with his book Japanese Candlestick Charting Techniques. Since then, candlestick charts have become a must-have tool for traders worldwide.
Anatomy of a Candlestick
Every candlestick tells a tale of tug-of-war between buyers and sellers.
A simple breakdown:
- Real Body: The thick part between the open and close.
- Wicks (or Shadows): Thin lines indicating highs and lows.
- Color: Green (bullish) shows buying pressure; Red (bearish) shows selling pressure.
Think of it as a candle with wax (the body) and wick (the shadow). The shorter the wick, the more confident the move. The longer the wick, the more confusion or volatility during that period.
Why Are Candlestick Patterns Important in Trading?
Candlestick patterns help traders understand market psychology at a glance. They highlight when momentum is building or fading.
For example:
- A small body with long wicks shows uncertainty.
- A long green candle signals strong buying.
- A long red candle warns of heavy selling.
In short, they act like road signs in trading—helping you decide when to move forward or stop.
How Many Candlestick Patterns Are There?
Here’s the big question—how many candlestick patterns are there?
There are over 100 recognized candlestick patterns, but traders commonly use around 30–40 major ones. These patterns can be grouped into three main categories:
- Single Candlestick Patterns – use just one candle.
- Double Candlestick Patterns – made up of two candles.
- Triple Candlestick Patterns – involve three candles that confirm trends or reversals.
Understanding these key patterns helps you interpret market behavior efficiently without being overwhelmed.
Popular Single Candlestick Patterns
These are easy to identify and ideal for beginners.
a) Doji
A “doji” forms when the open and close prices are nearly equal. It represents indecision. Imagine two equally strong wrestlers locked in a tie—no clear winner!
b) Hammer
A hammer signals a potential bullish reversal in a downtrend. It looks like a small body with a long lower wick—like a hammer trying to hit the market floor!
c) Shooting Star
A shooting star indicates a bearish reversal. It has a small body, long upper shadow, and appears after an uptrend—signaling that buyers are losing steam.
d) Spinning Top
A pattern with small bodies and long shadows, showing uncertainty. When traders can’t decide, the markets often pause before the next move.
Famous Double Candlestick Patterns
When two candles work together, amazing stories unfold.
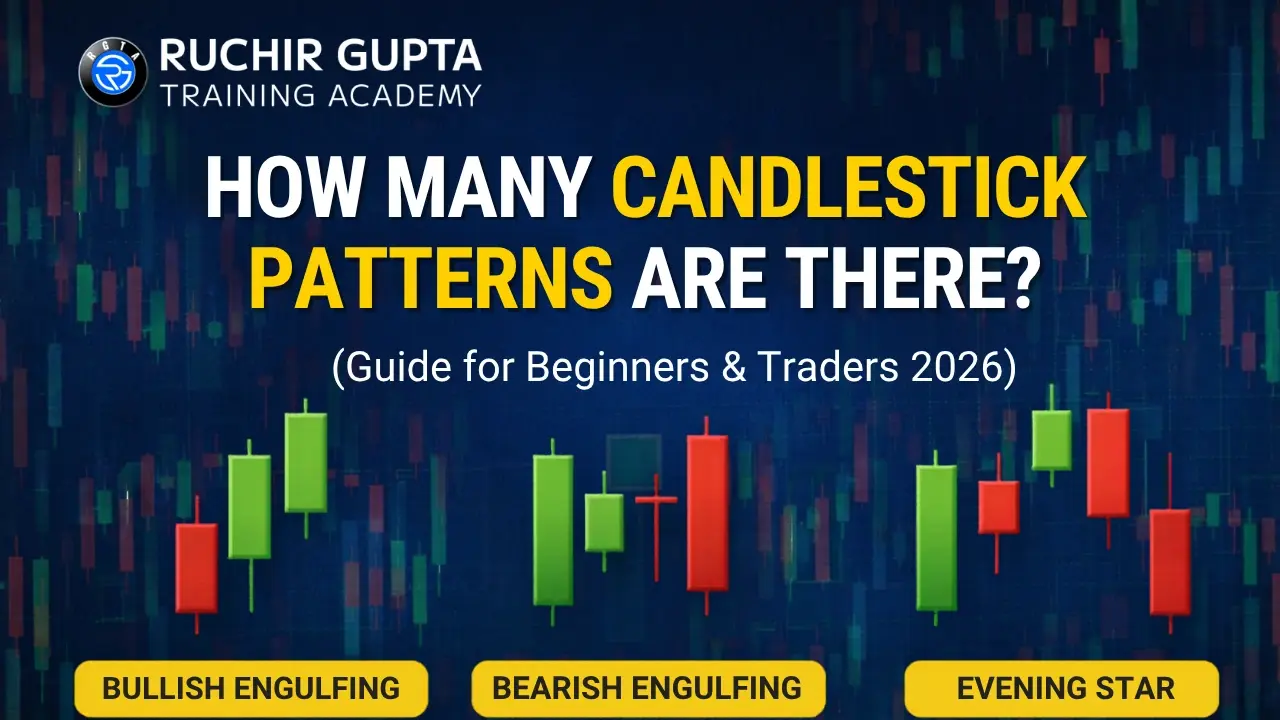
a) Bullish Engulfing
A small red candle followed by a large green one “engulfs” it, hinting buyers have taken control.
b) Bearish Engulfing
The reverse of the above—when a larger red candle swallows a small green one, signaling bearish momentum.
c) Tweezer Tops and Tweezer Bottoms
These appear at market turning points. Two candles share nearly the same highs (top) or lows (bottom), indicating potential reversals.
Powerful Triple Candlestick Patterns
Three candles often confirm stronger trend changes.
a) Morning Star
A favorite among stock market teachers! It occurs after a downtrend: a long red candle, a small indecisive one, then a strong green candle. It suggests the dawn of a new uptrend—hence “Morning Star.”
b) Evening Star
Exactly the opposite, forming after an uptrend and predicting a reversal to the downside.
c) Three White Soldiers
Three consecutive green candles with higher closes indicate strong bullish confidence.
d) Three Black Crows
Three consecutive red candles with lower closes represent mounting selling pressure.
Bullish Candlestick Patterns
These patterns indicate potential upward movement.
Popular examples:
- Dragonfly Doji
- Morning Star
- Piercing Pattern
- Bullish Harami
- Hammer
They’re like “green signals” from the market—showing when buyers might be stepping in to drive prices higher.
Bearish Candlestick Patterns
These patterns warn that the price could drop soon.
Common types include:
- Shooting Star
- Bearish Engulfing
- Evening Star
- Dark Cloud Cover
- Hanging Man
For traders, these are like flashing red lights—time to be cautious or take profits.
Continuation Candlestick Patterns
Sometimes, patterns don’t signal a reversal but confirm that the current trend will continue.
Examples include:
- Rising Three Methods (bullish continuation)
- Falling Three Methods (bearish continuation)
- Mat Hold Pattern
These patterns reassure traders that momentum hasn’t faded yet.
Reversal Candlestick Patterns
Reversal patterns are powerful because they signal a change in trend direction. Recognizing them early can enhance trading success.
Some key reversal signals:
- From bearish to bullish: Hammer, Morning Star, Piercing Pattern
- From bullish to bearish: Shooting Star, Evening Star, Dark Cloud Cover
They often appear when market sentiment is shifting—like the calm before a storm.
Common Mistakes Traders Make
Even experienced traders misread candlestick patterns sometimes. Common errors include:
- Ignoring the overall trend (patterns work best within context).
- Failing to confirm with volume or indicators.
- Trying to trade every single pattern.
- Forgetting that not all patterns guarantee results—markets can surprise you!
A good stock market teacher will remind you that trading is about probabilities, not perfection.
Tips From a Stock Market Teacher
Here’s what professional mentors often stress:
- Learn a few patterns well instead of chasing them all.
- Combine candlestick analysis with trendlines, volume, and support/resistance levels.
- Keep a trading journal to track patterns that work for you.
- Always use risk management—candlestick patterns can hint directions, not ensure profits.
Like learning to drive, candlestick reading takes practice and patience.
Final Thoughts and Conclusion
Candlestick patterns may look complex at first, but with time, you’ll start seeing them as market stories—each candle a small chapter of the bigger tale.
To sum up:
- There are over 100 recognized candlestick patterns, but around 30–40 major ones dominate real-world trading.
- They reveal market psychology, not just numbers.
- Mastering them can make you a better decision-maker, not just a better trader.
Whether you’re a beginner or aspiring stock market teacher, these patterns are your tool to decode human emotions trapped inside price charts.
Frequently Asked Questions (FAQs)
1. How many candlestick patterns are there in total?
There are more than 100, but most traders actively use around 30–40 main patterns for practical trading.
2. Are candlestick patterns reliable for trading?
They’re reliable when used with other indicators like volume or moving averages. Alone, they show tendencies—not guarantees.
3. Can beginners learn candlestick patterns easily?
Absolutely! Start with single candlestick patterns like the Hammer or Doji before moving on to advanced ones.
4. Do candlestick patterns work in crypto or forex trading too?
Yes. These patterns apply to any market where price and time data exist—stocks, forex, crypto, or commodities.
5. Who can teach candlestick patterns effectively?
A stock market teacher or professional trading mentor can help you interpret and apply these patterns correctly with real-world examples.